From Molecules to Matrices 🧬 - Part 1: Intro
A Data Scientist’s Intro to Single-Cell RNA Sequencing for the Virtual Cell Challenge by Arc institute. https://virtualcellchallenge.org
The last time I studied Biology and Chemistry together in-depth was in high school. This series of posts is my attempt to bridge that gap, an explanation of the key concepts that helped me (as a Data Scientist) understand the Virtual Cell Challenge by the Arc Institute. It’s a mix of applying what I already know, learning what I don’t, and writing it down to clarify my understanding (of course, with help from ChatGPT). There may be gaps or oversimplifications ahead, please feel free to point them out or expand in the comments.
This is Part 1, focusing on the core biological lingo and concepts needed to understand the data. We’ll go through the EDA and modelling in the Part 2, stay tuned!
The Problem: Why Virtual Cells?
The idea is to understand and predict how cells respond to different internal changes or external signals. If we can simulate the effects of these perturbations accurately, we can speed up biological experiments and reduce the need for trial-and-error in labs. This could make a big difference in how we study diseases, develop treatments, and explore cell behaviour in general.
Biological background
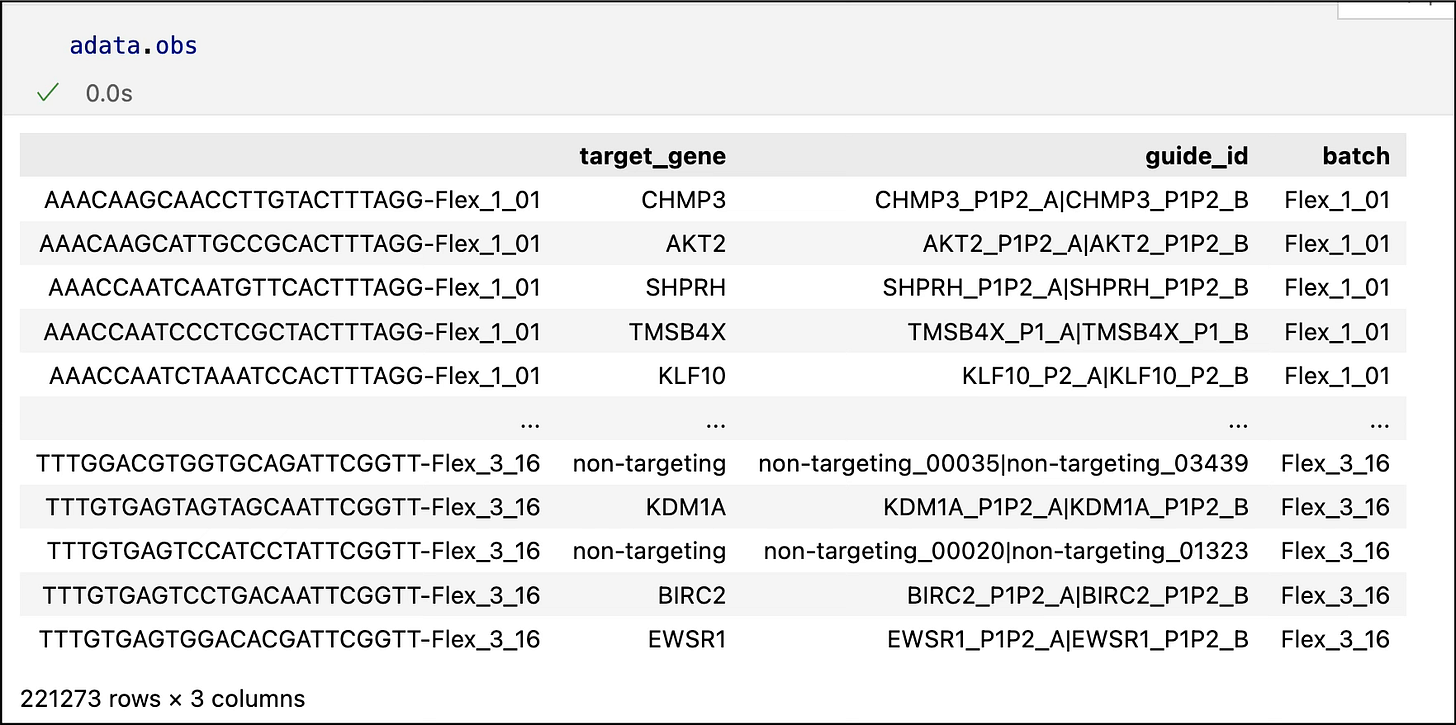
When I first looked at the data and saw terms like UMI, target_gene, and guide_id, etc., I realized I needed a quick refresher on the fundamentals. What exactly is single-cell sequencing, and how is it done? I’ve linked a few helpful resources at the end, but here’s the version that helped me make sense of it.
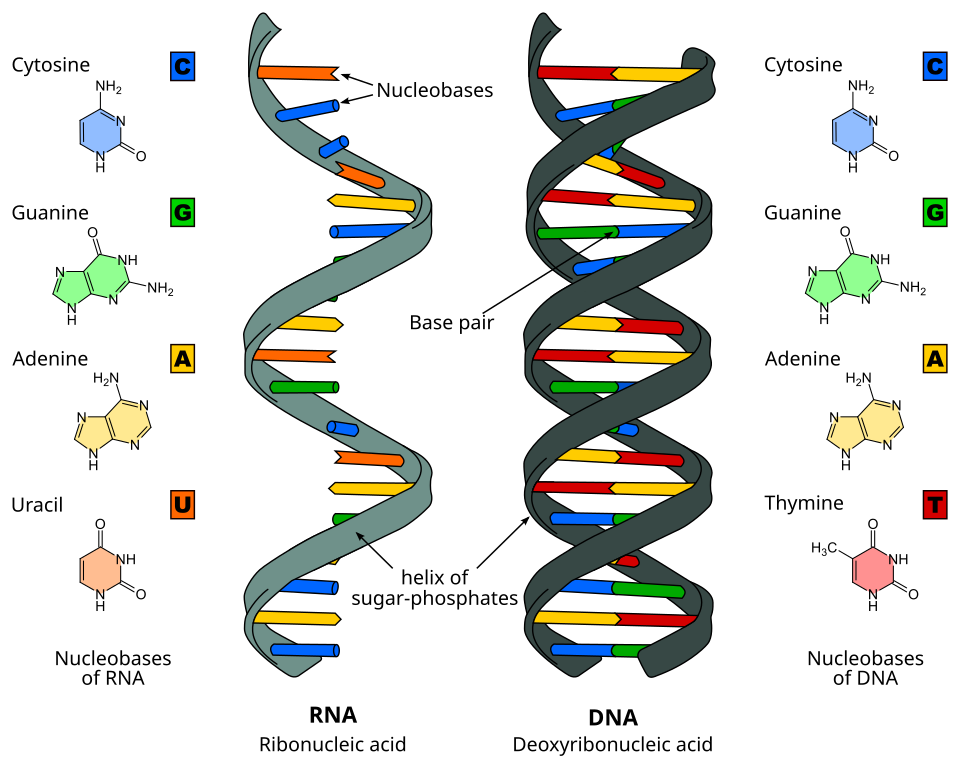
Cells are tiny, basic building blocks of all living organisms. They take nutrients, convert them to energy, do specialized functions, and contain DNA (deoxyribonucleic acid) and can make copies of themselves. You can think of human body as a composition of cells where each cell is a data point and is performing some specific function.
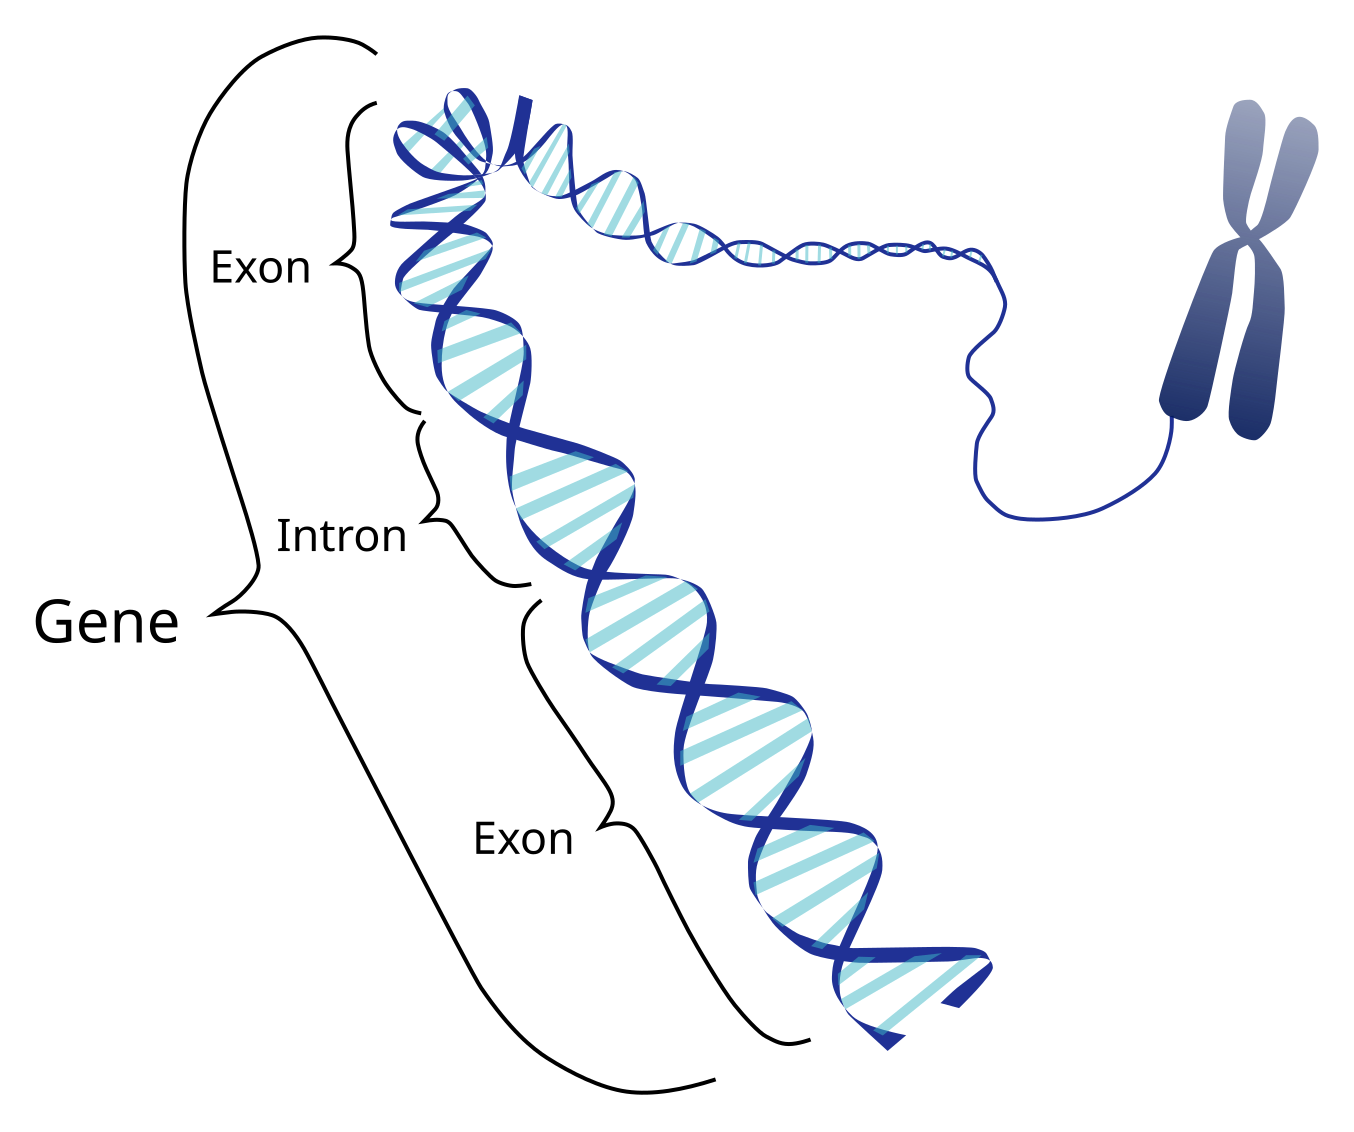
DNA (deoxyribonucleic acid) is like the source code (loosely, read-only) of biological molecules, and is hidden in the nucleus of a cell. It defines the instructions for the organism’s development and functions. Think of it as a long double-stranded string made up of “letters” (nucleotide bases A, C, G, T). It’s organized in chromosomes.
A Gene is a specific segment of DNA string that is used to define the building of protein molecules. Think of genes like small functions in a large file of DNA. Humans have about ~20,000 genes in their genome (all of DNA, like a full library of every gene in an organism).
Since DNA is like a read-only copy of instructions, mRNA (Messenger RNA) is a temporary single-stranded copy of a gene that copies the instruction from the DNA in the cell nucleus, to the protein factories of a cell. This is called transcription. Unlike DNA, RNA (Ribonucleic acid) differs chemically by having a hydroxyl (-OH) group at the 2' position of its sugar, making it more reactive and suitable for temporary roles like messaging. Proteins are the end product that influence the cell’s behaviour and characteristics, carry out most of the cell’s work, enzymes, signalling molecules, structural elements, etc. The process of making a protein from an mRNA template is called translation.
guide_id:
The identifier of the CRISPR guide RNA used to silence (perturb) a particular gene in a specific cell. Think of this as the ID of the molecular "scalpel" used to target a gene.
target_gene:
The gene that the CRISPR guide RNA is designed to silence or knock down. This is the gene whose impact we're trying to observe by perturbing it.
The Central Dogma
The relationship between DNA, RNA, and protein is often summarized by the central dogma of molecular biology [3]. It states that genetic information flows one-way: DNA is transcribed into RNA, which is then translated into protein. In other words, a gene (DNA) is used to create mRNA, and that mRNA is used to create protein.
Transcription: Inside the cell nucleus, an enzyme reads a gene’s DNA sequence and produces a complementary mRNA strand. This is akin to copying a specific recipe out of a massive cookbook (the genome) onto a notecard, the notecard (mRNA) contains just the instructions for one dish (protein). Only certain genes are transcribed in a given cell at a given time (depending on the cell’s type and state).
Translation: The mRNA travels out of the nucleus to a ribosome, which is like a 3D printer for proteins. The ribosome “reads” the RNA sequence and assembles the corresponding amino acids in order to build the protein. This is analogous to taking the recipe on the notecard and actually cooking the dish, the sequence of instructions (RNA) yields a finished product (protein).
What is Gene Expression?
This is where it gets interesting! In my understanding, each cell is supposed to have a complete copy of DNA, made of genes in the nucleus. Now, how does a liver cell differ from a brain cell?
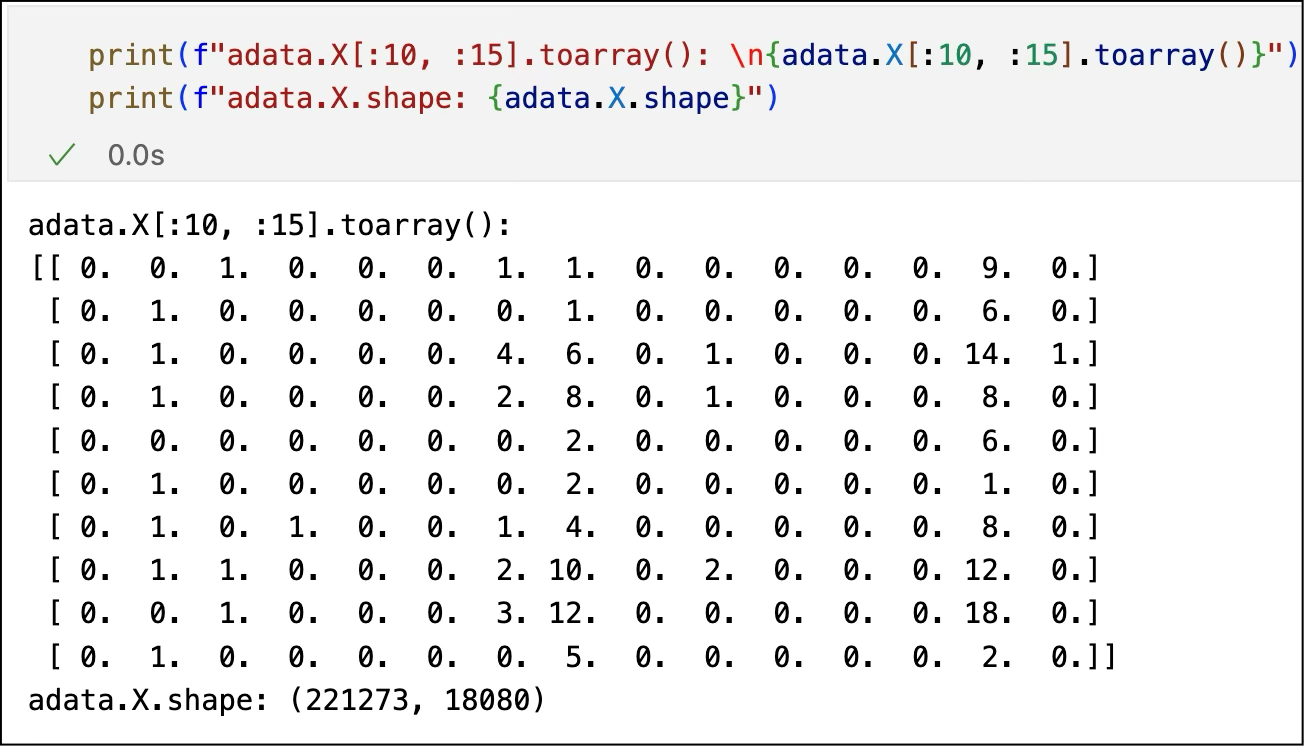
That is decided by the specific genes being “turned on” or “turned off”. If a grayscale image is structured based on the “intensity” of each pixel, here we can computationally represent each cell as a sparse vector ~20,000 dimensions for the human genome where each entry is a gene, and the value is the count of mRNAs (expression level). High count = gene was active; zero = gene off or not detected.
When a gene is “on,” it gets transcribed into mRNA. The complete set of these active transcripts in a cell at a given time is called the transcriptome. This is what we’re actually capturing with single-cell RNA sequencing; like a snapshot of what each cell is “expressing”. Thus, Gene expression refers to how much a gene is being used, how many mRNA copies were made from it.
The genome gives us the reference,
The transcriptome is the real-time readout,
And the gene expression matrix is what we actually model.
Now that we have the basic idea of DNA, genes, mRNA, proteins, etc. the next question is how do we actually read this “expression” of a cell in terms of genes? How do we get the cells x genes sparse matrix that the challenge has provided and what exactly do those matrix values represent?
Single-Cell RNA Sequencing: From Cells to Data
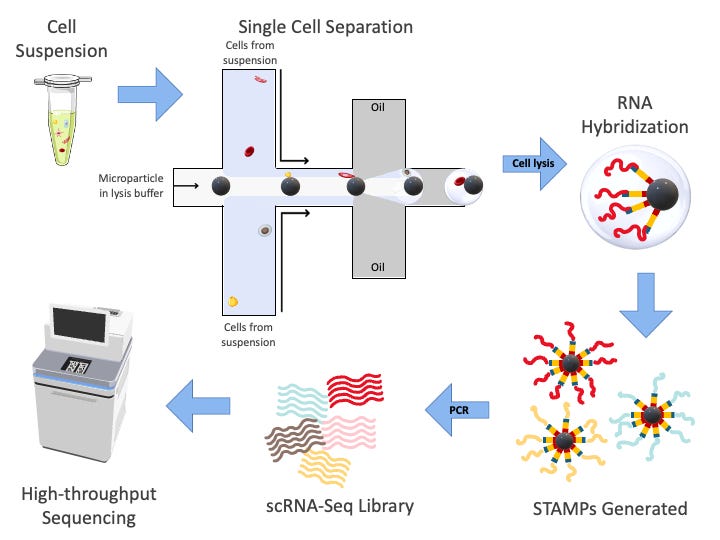
Rather than taking a bulk measurement across thousands of cells and getting an averaged gene expression profile, scRNA-seq lets us look at individual cells, each with its own context, gene expression levels, and possibly even cell type or state. This is explained and illustrated in the paper “Highly Parallel Genome-wide Expression Profiling of Individual Cells Using Nanoliter Droplets” by Macosko et al. [4]
Step 1: Isolate Cells and Tag Their RNA (Cell Barcodes + UMIs)
We start with a mixture of cells (from tissue, blood, etc). Each cell is isolated, often using something like microfluidics (10x Genomics’ droplet technology is a popular method). Picture tiny oil droplets, each trapping a single cell along with a bead carrying unique DNA barcodes.
As the cell is broken open (lysed), its mRNA spills out. The bead in that same droplet acts like a label-maker: its DNA primers attach to the mRNA and tag it in two ways:
A Cell Barcode: a tag shared by all mRNA from the same cell. It is key for matrix construction.
A UMI (Unique Molecular Identifier): a random short sequence that uniquely tags each original mRNA molecule. UMI is key for deduplication.
With cell barcode, we can trace every transcript reading to its cell origin. the UMI part took me a while to understand. It helps solve a problem of PCR duplication (discussed in next section)
Think of it this way: before sequencing, we'll need to make tons of copies of these fragile molecules. Without UMIs, we wouldn’t know if 100 identical reads came from 1 transcript or 100 different transcripts. UMIs act like serial numbers, if two reads have the same UMI, they’re likely just copies of the same original.
Step 2: Reverse Transcription → cDNA + PCR Amplification
mRNA is fragile and can’t be sequenced directly. So we convert it to a more stable form: cDNA (complementary DNA). This is done using reverse transcriptase.
At this point, each cDNA strand now contains:
A cell barcode
A UMI
And the actual gene-specific sequence (copied from the original mRNA)
But from a single cell, you only get a tiny amount of cDNA which is not enough to sequence. So we amplify it using PCR (Polymerase Chain Reaction).
This is like making hundreds or thousands of photocopies of each document. And again: this is where the UMI comes to the rescue later so we don’t confuse multiple PCR copies as multiple original transcripts.
Step 3: Sequencing (Reading the Molecular “Documents”)
Now we throw everything into a high-throughput sequencer (e.g., Illumina). It spits out millions of short reads, ~100-200 base pairs long.
Each read typically includes:
A part of the gene sequence (from the original mRNA)
A cell barcode
A UMI
All the cells are pooled together for sequencing, but thanks to the barcodes, we can later computationally demultiplex them. That is, sort out which read came from which cell.
At this point, we have tons of short reads from all over the transcriptome, each with labels that say “I came from Cell X and I am mRNA molecule Y.”
Step 4: Mapping Reads to the Reference Genome
Now we align the gene-specific portion of each read to a reference genome or transcriptome (e.g., human GRCh38).
This tells us which gene each read came from. For instance, if a read aligns to the ACTB gene, we assume it came from an ACTB transcript.
So now, for each read, we know:
What cell it came from (barcode)
What gene it came from (based on alignment)
What transcript it came from (based on UMI)
Step 5: UMI Deduplication → Expression Counts
Before counting gene expression, we need to deduplicate.
Because PCR introduced lots of copies, we don’t want to count them all. So we reduce reads by:
Cell barcode
Gene
UMI
If two reads come from the same cell, same gene, and same UMI, we count them once.
If two reads have the same gene and cell but different UMIs, they likely came from different original mRNAs and should each be counted.
The final result is a gene expression count matrix, where each cell-gene pair is assigned a count: the number of unique mRNA molecules (UMIs) detected for that gene in that cell.
What We Get: A Big Sparse Matrix
After going through all these steps, the final output is a giant matrix:
Rows = single cells
Columns = genes
Values = number of transcripts (post-UMI deduplication)
Most of the entries are zeros because most genes aren’t expressed in most cells. This matrix is the data we actually model.
Potential Sources of Error, and What That Means for Modelling
As clean as the pipeline may sound, real-world data is rarely perfect, and single-cell RNA-seq is no exception. From the moment a cell is captured to when it shows up as a row in your expression matrix, plenty of things can go wrong or get noisy. Here are some key sources of error, and what we can do about them:
1. Cell Capture & Lysis Failures
Some cells don’t get captured at all, or their membranes don’t fully break open (lyse), so their RNA never makes it into the data. This introduces sampling bias; some cell types might be underrepresented.
2. mRNA Dropout
Not every mRNA molecule in a cell gets captured and reverse-transcribed. This creates false zeros in your matrix i.e., a gene might be active, but we just missed it. This is a big reason why the count matrix is so sparse.
3. PCR Amplification Bias
Even with UMIs, some sequences get amplified more than others due to PCR stochasticity, which can skew apparent expression.
4. Barcode or UMI Errors
Sequencing errors can slightly alter the cell barcode or UMI, leading to either split counts (one molecule looks like many) or misassigned reads.
5. Ambient RNA Contamination
Free-floating RNA from lysed cells can get mistakenly tagged as belonging to a nearby intact cell, introducing noise.
6. Mapping Ambiguity
Some reads align to multiple locations or overlapping genes, leading to uncertainty in gene assignment.
Recap: From Cell to Count Matrix
Cell → Droplet with Barcode Bead
mRNA tagged with:
Cell barcode (which cell?)
UMI (unique transcript?)
mRNA → cDNA → PCR amplified
Sequenced as short reads
Aligned to genome → deduplicated by UMI
Result: A big sparse matrix of cell x gene expression counts
Resources:
https://commons.wikimedia.org/wiki/File:Difference_DNA_RNA.svg
https://commons.wikimedia.org/wiki/File:Gene_Intron_Exon_nb.svg
https://www.genome.gov/genetics-glossary/Central-Dogma
Macosko, Evan Z et al. “Highly Parallel Genome-wide Expression Profiling of Individual Cells Using Nanoliter Droplets.” Cell vol. 161,5 (2015): 1202-1214. doi:10.1016/j.cell.2015.05.002
https://commons.wikimedia.org/wiki/File:Drop-seq_workflow2.png
Additional videos
“Single-cell RNA-seq data analysis with Chipster” on YouTube (link)
“DNA and RNA - Transcription” by Nucleus Biology on YouTube (link)
“StatQuest: A gentle introduction to RNA-seq” by StatQuest on YouTube (link)
Once again, there certainly are some gaps, oversimplifications, please feel free to point them out or expand in the comments. In Part 2, we’ll dive into EDA and modelling. Thank you for reading, I really appriciate your time!

